









How Equipment Efficiency Affects Restaurant Profit Margins
How Kitchens Turn From Cost Centers Into Financial Assets
Content
Executive Summary: The Paradigm Shift in Hospitality Asset Valuation
The commercial kitchen, traditionally viewed as a utilitarian production center, has evolved into a complex financial ecosystem where capital allocation, operational efficiency, and regulatory compliance intersect with increasing volatility. For hotel owners, Food & Beverage (F&B) directors, and hospitality investors, the era of evaluating equipment based solely on sticker price and immediate availability has definitively ended. The modern hospitality landscape—characterized by shrinking profit margins, labor scarcity, rising utility costs, and stringent environmental regulations—demands a sophisticated, data-driven understanding of Return on Investment (ROI) and Total Cost of Ownership (TCO).
This report serves as an exhaustive financial and operational blueprint for the RON Group Global audience. It deconstructs the methodology required to calculate the true financial performance of commercial kitchen equipment, moving beyond basic amortization schedules to incorporate multi-variable analyses. We explore the profound economic implications of energy density, the “hidden” inflation of water and sewage rates, the strategic deployment of automation to mitigate labor market risks, and the looming capitalization cliffs presented by environmental mandates like the EPA’s SNAP 2025 rule.
By synthesizing data from federal regulatory bodies, industry performance benchmarks, and advanced financial modeling, this document establishes a rigorous decision-making framework. It posits that kitchen equipment must be managed not merely as depreciating operational necessities, but as strategic financial instruments capable of delivering measurable yield, hedging against inflation, and securing long-term enterprise value.
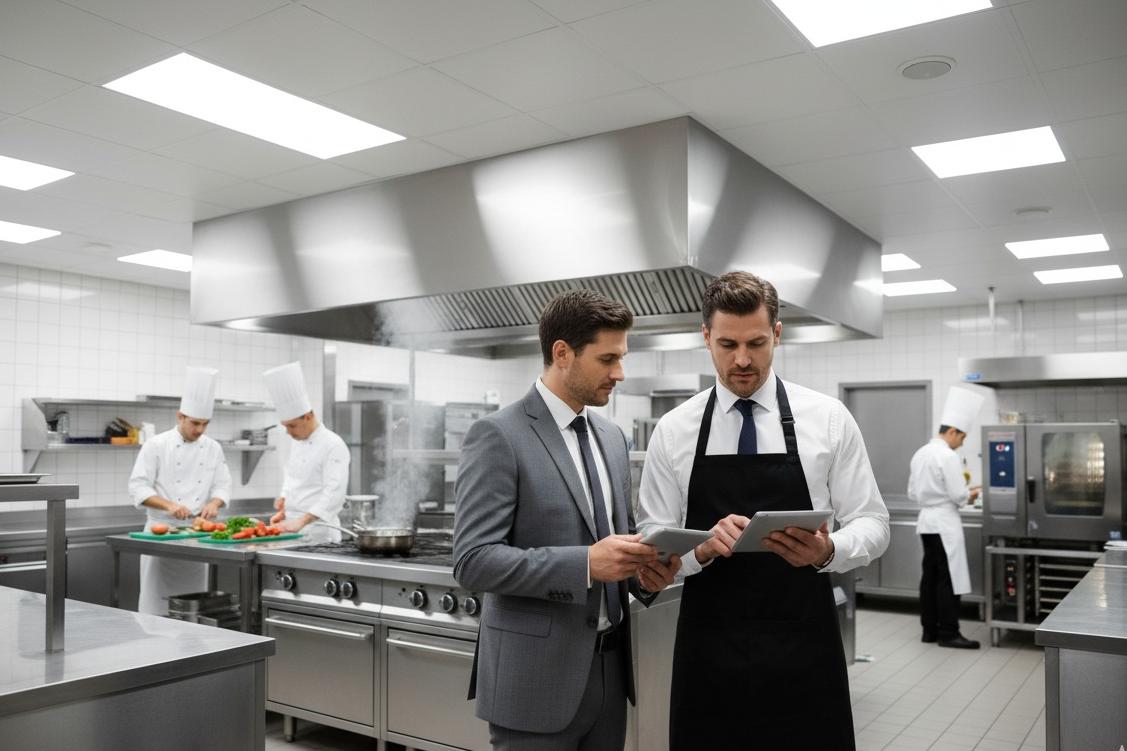
Part I: The Macro-Economic Context of Kitchen Asset Management
To accurately calculate ROI, one must first understand the economic theater in which these assets operate. The hospitality sector is currently navigating a “perfect storm” of inflationary pressures that distort traditional payback periods and necessitate a more dynamic approach to capital expenditure (CAPEX).
1.1 The Erosion of Margins and the Efficiency Imperative
Historically, restaurant and hotel food service operations operated with a buffer that allowed for inefficiencies in utility usage and labor allocation. That buffer has evaporated. The “30/30/30/10 rule”—a long-standing benchmark for restaurant operating costs—is under siege. Labor costs in many markets have breached the 35% threshold, and food costs remain volatile due to supply chain disruptions. In this environment, the “overhead” wedge—specifically utilities and maintenance—becomes the primary lever for margin protection.
Equipment selection is the most significant determinant of this overhead. A decision to purchase a standard-efficiency deep fryer over a high-efficiency model is not a one-time savings of capital; it is a decision to lock the operation into a higher operational expenditure (OPEX) structure for the next seven to ten years. Conversely, investing in energy-efficient infrastructure acts as a hedge against future utility rate hikes, effectively “buying down” the future cost of doing business.
1.2 The “War for Talent” and the Role of Equipment
The labor market for skilled culinary professionals is tighter than at any point in recent history. This scarcity drives up wages and increases the cost of turnover. Consequently, the ROI of kitchen equipment can no longer be calculated solely on energy savings; it must be calculated on “Labor Aversion” and “Retention Value.”
Equipment that automates repetitive, low-skill tasks—such as vegetable slicers or automatic glass polishers—does not just save hours; it changes the nature of the work. It allows operators to utilize labor budgets for high-value tasks that directly impact guest satisfaction, rather than backend processing. Furthermore, equipment that reduces physical strain or improves the thermal comfo rt of the kitchen contributes to lower turnover rates and reduced Workers’ Compensation claims.
1.3 The Regulatory Cliff: EPA SNAP 2025
Perhaps the most urgent macro-factor is the regulatory environment regarding refrigerants. The American Innovation and Manufacturing (AIM) Act and the EPA’s Significant New Alternatives Policy (SNAP) are phasing out high-Global Warming Potential (GWP) hydrofluorocarbons (HFCs). Effective January 1, 2025, the installation of certain new equipment using legacy refrigerants will be restricted, according to the EPA’s technology transition rules.
This creates a “Compliance Asset Class.” Equipment purchasing decisions made today must account for the risk of asset stranding—owning equipment that is legal to run but increasingly expensive to service as refrigerant supplies dwindle. The ROI calculation for a walk-in cooler today must include a risk premium for the refrigerant type it uses, favoring low-GWP alternatives like R-290 (propane) or CO2, which are future-proof against these regulatory shifts.
Part II: The Theoretical & Mathematical Framework of ROI & TCO
2.1 Redefining ROI in the Foodservice Context
Return on Investment (ROI) is the fundamental metric for capital allocation, yet in the kitchen, it is frequently misapplied. The standard formula—ROI=(NetProfit/CostofInvestment)×100—assumes a direct revenue correlation. However, kitchen assets generally fall into two distinct financial categories, each requiring a modified calculation methodology.
Revenue-Generating Assets
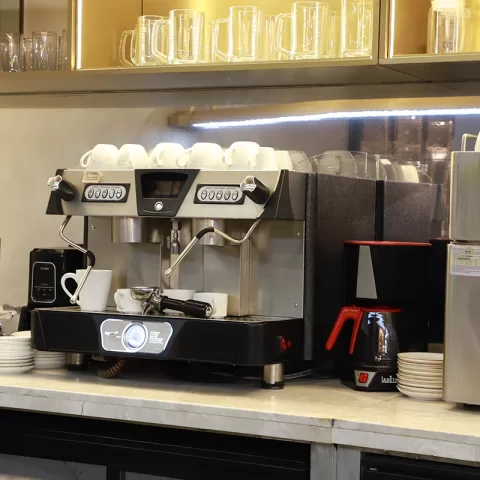
These assets directly drive top-line growth. They include espresso machines, soft-serve ice cream dispensers, or specialized pizza ovens that enable a new menu category.
The Calculation: For these assets, “Net Profit” is the gross margin of the new product sales minus the specific operating costs of the machine.
Example: A $20,000 investment in a high-end coffee machine that generates an additional $4,000 in net profit achieves a first-year ROI of 20%.
Nuance: The calculation must account for the ramp-up period (marketing the new offering) and the cannibalization risk (does selling a latte reduce the sale of regular coffee?).
Margin-Defense Assets
The majority of kitchen infrastructure—dishwashers, ventilation, refrigeration, fryers—defends profit margins rather than generating new revenue. For these assets, “Net Profit” is replaced by “Annualized Operational Savings.”
The Calculation: ROI=(Annual Savings / Incremental Cost)×100.
Incremental Cost: This is crucial. You are often comparing the cost of a premium unit against a baseline unit. If a standard fryer costs $1,500 and an efficient one costs $3,500, the investment is the $2,000 difference, and the ROI is calculated based on how quickly the savings recoup that $2,000.
2.2 The Total Cost of Ownership (TCO) Imperative
Total Cost of Ownership is the holistic financial view, essential for assets with long lifecycles. TCO exposes the fallacy of “low bid” procurement. A piece of equipment with a low acquisition price but high energy and repair costs can be 18–34% more expensive over a 10-year period than a premium alternative. This is where a strategic approach becomes critical. For hospitality leaders, understanding how to source quality equipment at factory prices is paramount to managing TCO effectively.
The comprehensive TCO formula for commercial kitchens is:
TCO= Ic + ∑ n / t=1 (Ec + Wc + Lc + Mc + Dc) / (1+r)t − Rv
Where:
Ic: Initial Acquisition Cost (Purchase Price + Freight + Installation + Training).
Ec: Energy Costs (Electricity/Gas consumption).
Wc: Water/Sewer Costs (Water usage + Sewage multipliers).
Lc: Labor Costs (Operational labor + Cleaning time).
Mc: Maintenance Costs (Preventative + Corrective + Parts).
Dc: Downtime Costs (Lost revenue + Emergency mitigation).
Rv: Residual Value (Resale or scrap value).
n: Lifespan (Years).
r: Discount Rate (Cost of capital, typically 5-8%).
Key Insight: Our analysis shows that energy bills alone can consume up to 45% of an equipment’s lifetime costs. Furthermore, unscheduled downtime can cost operations between $550 and $1,200 per hour. Excluding these variables results in a “fantasy” budget that inevitably leads to operational variances.
2.3 The Time Value of Money: Payback Period and NPV
For hotel owners managing large portfolios, the Payback Period is a critical liquidity metric. It answers: “How long until I get my cash back?”
Benchmark: A payback period of 3 to 5 years is the standard acceptance threshold for technology and heavy machinery in hospitality, a standard noted in financial modeling.
High-Efficiency Data: Based on our analysis, commercial refrigerators often demonstrate a payback of ~2.8 years, while steam kettles may take ~4.1 years.
Net Present Value (NPV): In an environment of higher interest rates, future savings are worth less than present cash. TCO models should discount future cash flows to understand if the upfront premium is truly justified by future savings.
Part III: The Energy Equation – Electricity, Gas, and Thermodynamic Efficiency
Energy consumption is the largest variable operational cost in the kitchen. With utility rates rising globally, the energy density of equipment determines its long-term viability. The U.S. EPA and Department of Energy (DOE) provide critical benchmarks through the Energy Star program.
3.1 The Energy Star Premium
Energy Star-certified commercial food service (CFS) equipment is engineered to reduce energy consumption by 10% to 50% compared to standard models. This efficiency is not magic; it is the result of superior insulation, variable speed drives (VSD), and advanced heat exchange technologies.
Table 1: Annual Operating Cost Comparison (Standard vs. Efficient)
| Equipment Type | Annual Energy Cost (Standard) | Annual Energy Cost (Efficient) | Annual Savings | Payback Period (Years) |
|---|---|---|---|---|
| Commercial Refrigerator | $2,100 | $1,450 | $650 | 2.8 |
| 60-Gallon Steam Kettle | $3,800 | $2,900 | $900 | 4.1 |
| Convection Oven (Electric) | $4,000 | $3,080 | $920 | 3.2 |
| Commercial Dishwasher | $5,133 | $3,517 | $1,616 | 1.5 |
Source: Derived from industry data and U.S. Department of Energy benchmarks.
Strategic Insight: The savings are compounded when considering the Ambient Heat Load. Inefficient gas equipment radiates massive amounts of waste heat into the kitchen. This forces the building’s HVAC system to work harder to maintain a safe working temperature.
The Multiplier: For every 1 kWh of electricity saved by an efficient appliance, there is often an additional ~0.3 kWh saved in HVAC cooling load. This secondary ROI is rarely calculated but significantly impacts the property’s total energy footprint, a key finding in recent ENERGY STAR program reports.
3.2 The Shift to Induction and Electric
The industry is seeing a structural shift from gas to electric, specifically induction cooking.
Efficiency: Gas burners are notoriously inefficient, transferring only 40-50% of energy to the food. Induction transfers 90%+.
Cost Dynamics: While electricity is often more expensive per unit than natural gas, the efficiency gain of induction can neutralize this cost difference. Furthermore, as municipalities move to decarbonize, investing in electric infrastructure is a future-proofing strategy.
New Standards: The EPA’s Version 1.0 specification for commercial electric cooktops introduces a minimum cooking efficiency of 80%, offering lifetime savings of roughly $200 and 1,800 kWh per hob, according to the latest CFS newsletter.
3.3 Managing Idle Load
A critical “hidden” energy thief is idle load—energy consumed when the machine is on but not cooking.
The Data: A standard dishwasher might draw 0.87 kW while idle. An Energy Star certified model might draw only 0.55 kW, or even enter a “sleep” mode drawing near zero.
Operational ROI: Equipment with intelligent “sleep” modes or fast recovery times allows staff to turn equipment off during slow periods without fear of impacting service speed. This behavior modification, enabled by technology, drives substantial ROI.
Part IV: The Water & Waste Nexus
Water costs are rising faster than energy costs in many jurisdictions, driven by aging infrastructure and scarcity. For 2025, cities are reporting rate hikes from 5.55% in Cincinnati to 20% in cities like Birmingham, MI. This escalation fundamentally alters the ROI for water-intensive assets.
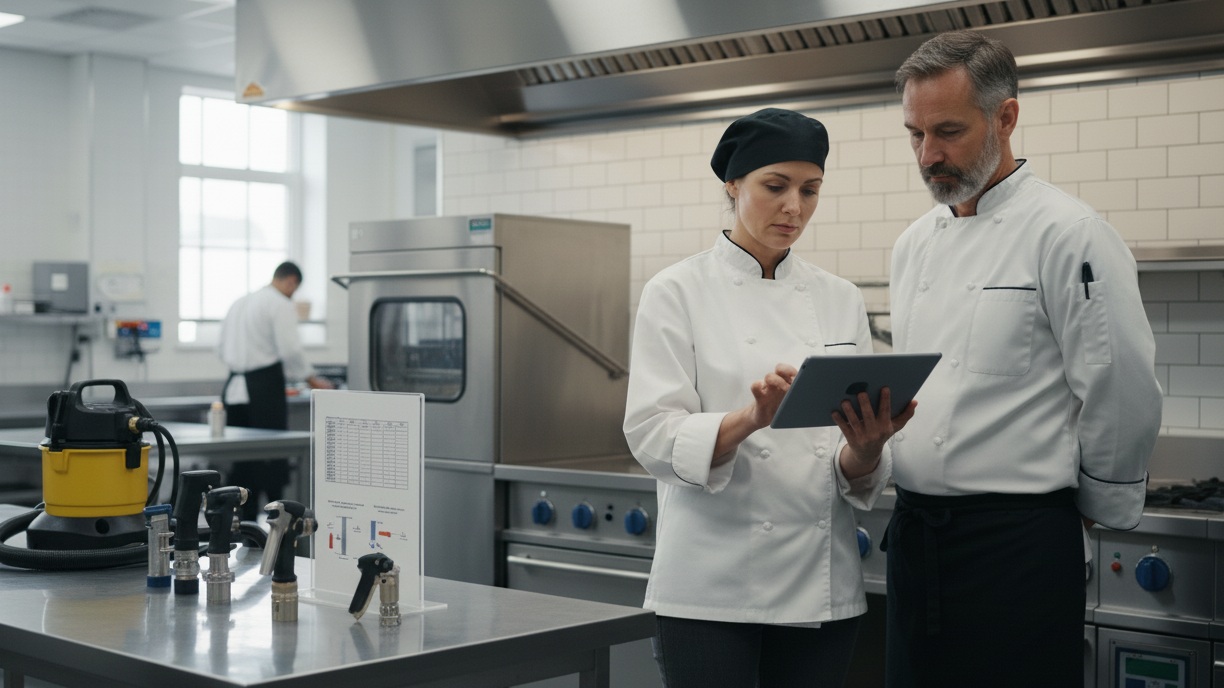
4.1 The “Double Bill” of Water and Sewer
It is critical for F&B managers to understand that they pay for water twice: once to bring it in (water rate) and once to send it out (sewer rate).
The Multiplier: Sewer rates are often calculated as a percentage of metered water usage. In New York City, the sewer rate is 159% of the water charge, a policy detailed by the city’s water board.
Implication: Saving one gallon of water saves the cost of 2.59 gallons (1.0 water + 1.59 sewer). This dramatic multiplier means that water-saving technologies have some of the fastest payback periods in the industry.
4.2 Commercial Dishwashers: The ROI Champions
The commercial dishwasher is the largest consumer of water in the kitchen. The efficiency gap between legacy models and modern Energy Star units is profound.
Table 2: Dishwasher Water Consumption and Financial Impact
| Machine Type | Standard Usage (Gal/Rack) | Energy Star Usage (Gal/Rack) | Annual Usage (Standard)* | Annual Usage (Efficient)* | Water Saved (Gallons) | 10-Year Cost Savings** |
|---|---|---|---|---|---|---|
| Undercounter | 1.70 | 0.86 | 93,075 | 47,085 | 45,990 | ~$9,198 |
| Door Type (High Temp) | 1.29 | 0.89 | 141,255 | 97,455 | 43,800 | ~$8,760 |
| Single Tank Conveyor | 0.79 | 0.70 | 259,515 | 229,950 | 29,565 | ~$5,913 |
| Multi-Tank Conveyor | 0.54 | 0.37 | 354,780 | 243,090 | 111,690 | ~$22,338 |
*Assumptions: Undercounter (150 racks/day), Door (300 racks/day), Conveyors (900/1800 racks/day respectively), 365 days operation.
**Cost Assumption: Combined Water/Sewer rate of $20.00 per 1,000 gallons (conservative blend of rising 2025 rates).
Analysis: A multi-tank conveyor dishwasher can save over $22,000 in water/sewer costs alone over a decade. When combined with the energy savings from heating less water, the TCO advantage is undeniable, a fact supported by Department of Energy case studies.
4.3 Spray Valves and Pre-Rinse ROI
The humble pre-rinse spray valve is often the lowest-hanging fruit for ROI.
The Math: Replacing a 2.6 gallon-per-minute (gpm) valve with a 1.6 gpm valve saves 1.0 gpm.
Impact: If used 3 hours a day, this saves 180 gallons daily, or roughly 65,000 gallons annually.
ROI: A high-efficiency valve costs ~$100. The water savings (at $20/kGal) is $1,300/year. The payback period is less than one month, with an annual ROI of over 1,000%, as confirmed by utility saving analyses.
Part V: Labor Economics & Automation
In 2024 and beyond, labor is the most volatile and expensive line item on the P&L, typically consuming 25-35% of revenue, according to industry financial breakdowns. The “ROI of Automation” is derived from the ability to decouple production volume from labor hours.
5.1 Vegetable Preparation: The Speed of Profit
Manual vegetable preparation—slicing, dicing, chopping—is the bottleneck of the prep kitchen. It is slow, inconsistent, and dangerous.
Industry Tools: Recent industry tools enable precise labor savings calculations for continuous-feed food processors.
Scenario: A kitchen spends 3 hours daily hand-cutting vegetables. At $18/hour, this costs $19,710 annually.
Automation: A commercial processor can process 11-17 pounds per minute. The same 3-hour task is completed in roughly 30 minutes.
Savings: 2.5 hours/day saved = $16,425 annual labor savings.
Payback: With a machine cost of ~$2,500, the ROI is over 600% in year one.
Secondary Benefits: Machine cuts are uniform, ensuring consistent cooking times and presentation. There is also a significant reduction in waste (higher yield), which lowers food costs.
5.2 Automated Glass Polishing: Breaking the Cycle of Breakage
For hotel bars, banquet halls, and high-volume restaurants, polishing glassware is a silent profit killer.
Speed: Automated glass polishers are 5x faster than manual polishing. One staff member with a machine can polish 250–500 glasses per hour.
Breakage ROI: Manual polishing involves torque (twisting the glass), which is the primary cause of stemware breakage. Machines use hot air and soft microfiber brushes, virtually eliminating breakage.
Calculation: If a hotel breaks 20 glasses a week at $5/glass, the annual cost is $5,200. Eliminating this saves the equivalent of the machine’s cost in roughly one year, irrespective of labor savings.
Hygiene: Automated drying removes the “dirty towel” variable, reducing cross-contamination risk—a critical compliance factor in the post-pandemic era.
5.3 The Hidden Cost of Manual Labor: Insurance and Safety
While difficult to itemize on a single receipt, the reduction of injury risk is a TCO factor. Kitchens are high-risk environments for cuts and repetitive strain injuries.
Insurance Impact: A single Workers’ Compensation claim can increase insurance premiums for years. Investing in safety-focused automation demonstrates a commitment to safety that can be leveraged during insurance renewals to negotiate better rates.
Part VI: The Regulatory Horizon – EPA SNAP 2025
The most significant “Black Swan” event for kitchen ROI is the regulatory transition of refrigerants. The EPA’s Technology Transitions Rule under the AIM Act is forcing a hard stop on high-GWP refrigerants.
6.1 The 2025 Compliance Mandate
Effective January 1, 2025, the EPA restricts the installation of new refrigeration systems using high-GWP HFCs (like R-404A and R-134a) in specific subsectors, including retail food refrigeration and cold storage, a mandate detailed in the EPA’s Technology Transitions Rule.
The Phase-Down: The production of these HFCs is being aggressively cut (down to 15% of baseline by 2036). This guarantees that the cost of legacy refrigerants will skyrocket due to scarcity.
6.2 The Risk of Asset Stranding
Purchasing a “bargain” refrigerator today that uses R-404A is a financial trap.
Maintenance Cost Spike: As R-404A supply dwindles, a simple leak repair in 2027 could cost 5x-10x more than today due to the cost of the gas.
Resale Value: The resale market for non-compliant equipment will collapse.
The TCO Adjustment: ROI models for refrigeration MUST assume zero residual value (Rv=0) for HFC units and should budget for significantly higher maintenance costs in years 5-10.
6.3 The Low-GWP Opportunity
The industry is pivoting to R-290 (Propane) and R-600a (Isobutane).
Efficiency: These hydrocarbons are thermodynamically superior. R-290 units typically consume 20-40% less energy than their HFC predecessors.
Future-Proofing: These refrigerants have near-zero GWP, meaning they are immune to future climate regulations. As confirmed by the EPA’s ongoing regulatory actions, investing in R-290 equipment is an “inflation-proof” strategy for the refrigeration fleet.
Part VII: Asset Lifecycle Management
The operational lifespan of equipment is a variable that can be managed, but knowing when to “pull the plug” is a financial art form.
7.1 The “Repair vs. Replace” Matrix
F&B managers often fall victim to the “Sunk Cost Fallacy”—continuing to repair a unit because they have already spent money fixing it. A disciplined approach uses the 50% Rule:
Guideline: If the cost of a repair exceeds 50% of the equipment’s current replacement value, replacement is the financially sound choice.
This decision-making process mirrors the lifecycle analysis for other key assets, including determining how often to replace restaurant furniture to maintain brand standards and avoid guest dissatisfaction. A refined Decision Matrix also includes:
Age Factor: Is the equipment past 60% of its expected life? (e.g., a fryer > 6 years).
Efficiency Gap: Will a new unit reduce utility bills? Calculate the “Energy Subsidy”—if a new unit saves $50/month, that is $3,000 over 5 years that subsidizes the purchase price.
Reliability Cost: What is the cost of downtime? If a walk-in fails twice a year, risking $5,000 in inventory, the “cost” of the old unit is not just the repair bill—it is the risk exposure.
7.2 Preventative Maintenance (PM) as ROI
Maintenance should be budgeted as a fixed cost, typically 1.5% to 3% of annual revenue, a common benchmark in restaurant maintenance budgeting.
The ROI of PM: Regular cleaning of condenser coils can reduce energy consumption by 10-15% and extend compressor life by years. A $500 annual service contract that extends a $5,000 unit’s life from 7 years to 10 years yields a high return by deferring CAPEX, a core principle of calculating maintenance ROI.
Warranty Integrity: Most warranties are conditional on proof of maintenance (e.g., changing water filters). Failing to maintain the unit voids the “insurance” of the warranty, destroying TCO value.
Part VIII: Strategic Equipment Analysis
We apply the TCO framework to three critical equipment decisions.
8.1 The Oven Debate: Combi vs. Convection
Convection: Low entry price, simple, reliable for dry baking.
Combi (Combination): High entry price, complex, offers steam + convection.
The Financial Case for Combi:
Yield: Combi ovens cook proteins with humidity, reducing shrinkage by up to 20% compared to dry convection. For a hotel roasting prime rib, 10% more yield equals thousands of dollars in “found revenue” annually.
Consolidation: One Combi can replace a convection oven, a steamer, and a holding cabinet. This saves roughly 3-4 linear feet of hood space. In construction, hood space can cost ~$1,500 per linear foot to install. Saving space reduces the construction budget and ongoing ventilation energy costs.
Versatility: Combis allow for sous-vide style cooking overnight (unattended), effectively adding a “ghost shift” of production without labor costs.
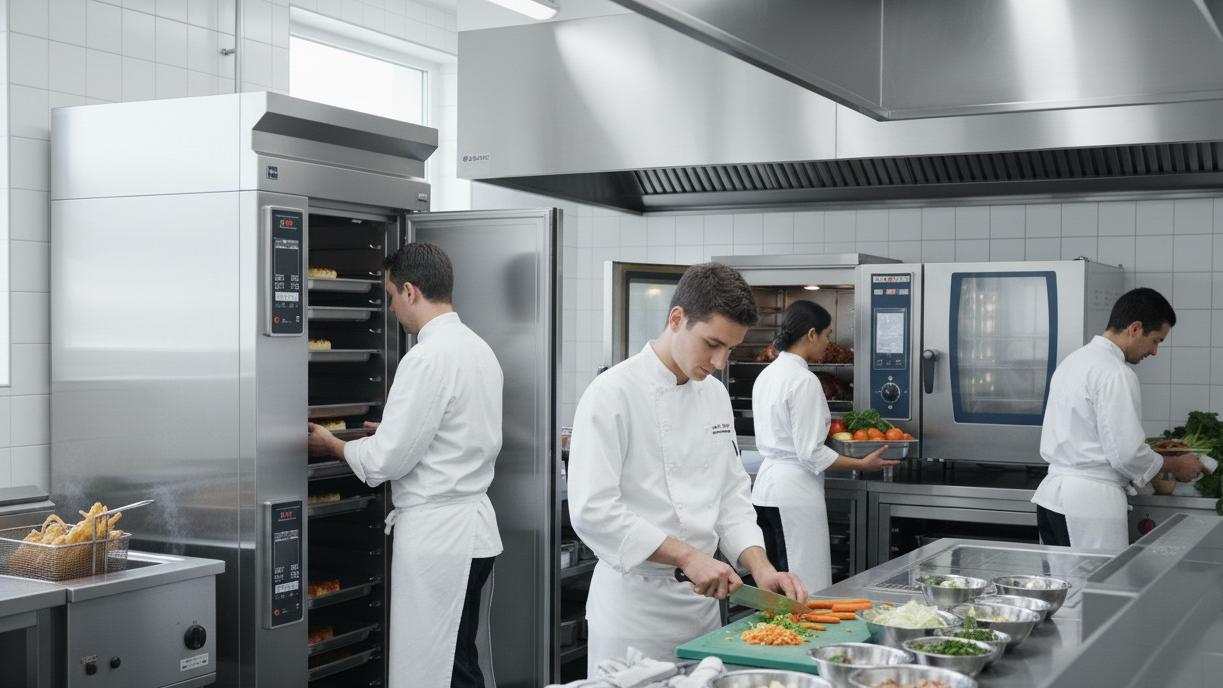
8.2 Blast Chillers: Food Safety and Waste Reduction
Blast chillers are often seen as luxury items, but their ROI is rooted in Waste Reduction and Labor Scheduling.
Labor: They allow kitchens to cook in bulk (e.g., making 50 gallons of soup once a week vs. 10 gallons daily) and safely chill it. This “batch cooking” optimizes labor efficiency.
Waste: By rapidly cooling food through the “Danger Zone,” shelf life is extended from 3 days to 5+ days, significantly reducing spoilage waste.
8.3 High-Efficiency Fryers
Oil Savings: Advanced fryers use roughly 40-50% less oil to fill the vat and have filtration systems that extend oil life by days.
The Math: If a fryer saves $3,000 in oil costs annually (a conservative estimate for high volume), the payback on the “premium” price of the fryer is often less than 12 months.
Part IX: The Hidden Costs of Installation & Infrastructure
A common pitfall in budgeting is focusing on the “Box Price” and ignoring the “Deployed Cost.”
9.1 The “Installed Cost” Multiplier
The sticker price is typically only 70-80% of the final cost to get the equipment running.
Installation: Professional installation, calibration, and utility connections typically cost 10-20% of the equipment price.
Infrastructure: Installing a new high-capacity ice machine might require upgrading a floor drain or running a new electrical circuit. Fit-out costs can average $250 per square foot.
Contingency: It is recommended to allocate a 30% contingency budget for hidden installation costs such as grease trap upgrades, ventilation adjustments, and code compliance retrofits, a figure supported by commercial fit-out cost analyses.
9.2 Water Quality: The Warranty Killer
Water filtration is not optional. Limescale is the primary killer of steamers, combi ovens, and ice machines.
Risk: Most manufacturers will void the warranty if water quality standards are not met.
ROI: A $300 filter system protects a $20,000 asset. The ROI is effectively infinite because it insures the entire capital investment against premature failure.
Part X: Financial Engineering for Hospitality
10.1 Section 179 and Bonus Depreciation
For US-based operations, the tax code provides powerful levers to improve first-year ROI.
Section 179: Allows businesses to deduct the full purchase price of qualifying equipment up to $1,220,000, according to the 2024 IRS guidelines. Example: Buying $50,000 of equipment allows a $50,000 deduction. At a 21% corporate tax rate, this saves $10,500 in cash taxes, effectively reducing the equipment cost to $39,500.
Bonus Depreciation: This allows for accelerated depreciation of assets. It is phasing down: 60% in 2024, 40% in 2025, and 20% in 2026 a critical change for 2024 noted by tax professionals. Strategy: There is a financial incentive to accelerate purchases into the 2024/2025 tax years to capture higher depreciation rates before they decline.
10.2 Fire Suppression and Insurance Discounts
Investing in safety yields financial returns through insurance premiums.
Discounts: Insurance carriers often offer premium discounts ranging from 5% to 15% for facilities with fully compliant, maintained fire suppression systems (UL 300). Some analyses show that advanced monitoring can deepen discounts to as much as 45%.
Underwriting: Compliant equipment places the business in a lower risk class, protecting against rate hikes.
10.3 Leasing vs. Buying
Leasing: Preserves working capital. It shifts the cost from CAPEX to OPEX. It is ideal for rapidly depreciating assets (like ice machines) or for startups with cash flow constraints.
Buying: Offers the lowest TCO (no interest payments) and allows for the tax benefits of Section 179. Ideal for long-life assets (ovens, walk-ins) in established businesses with cash reserves.
Conclusion: The Strategic Asset Management Approach
The calculation of ROI for commercial kitchen equipment is a multidimensional exercise that transcends simple arithmetic. It requires the integration of engineering data (energy/water), operational metrics (labor/yield), risk management (insurance/compliance), and fiscal strategy (tax/depreciation).
For RON Group Global’s clients—hotel owners and F&B managers—the imperative is clear: The equipment with the lowest price tag frequently carries the highest cost.
To maximize financial performance, operators must:
Adopt TCO over Price: Use the TCO formula to evaluate every asset costing over $2,000.
Prioritize Efficiency: Leverage Energy Star and water-saving technologies to insulate the business against the rising tide of utility inflation.
Automate to Elevate: Invest in labor-saving machinery to mitigate wage inflation and improve staff retention.
Future-Proof: Ensure all refrigeration procurement adheres to 2025 EPA SNAP regulations to avoid asset stranding.
Leverage the Tax Code: Utilize Section 179 to subsidize capital improvements, but act swiftly to capture fading bonus depreciation rates.
By treating kitchen equipment as a portfolio of financial assets rather than mere tools, hospitality leaders can unlock significant value, turning the “back of house” from a cost center into a driver of enterprise value. For a detailed consultation on sourcing the right equipment for your next project, contact the RON Group Global team.
Appendix: Quick Reference Formulas
1. Basic ROI:
$$ ROI (%) = \frac{\text{Annual Net Savings} \times \text{Lifespan} - \text{Initial Investment}}{\text{Initial Investment}} \times 100 $$
2. Payback Period (Years):
$$ \text{Payback Period} = \frac{\text{Initial Investment}}{\text{Annual Operating Cash Flow (Savings)}} $$
3. Total Cost of Ownership (Annualized):
$$ \text{Annual TCO} = \frac{\text{Initial Cost} - \text{Resale Value}}{\text{Years}} + \text{Annual Operating Costs} $$
4. Net Present Value (NPV):
Where Rt = Net cash inflow-outflows during a single period t, i = Discount rate or return that could be earned in alternative investments, t = Number of time periods.
Sources Used in the Report
Restaurant Operating Costs Breakdown: Complete Guide for Owners - restauranttimes.com
EPA Proposes Reforming Biden Technology Transitions Rule to … - epa.gov
Technology Transitions HFC Restrictions by Sector | US EPA - epa.gov
Total Cost of Ownership (TCO) Explained - NetSuite - netsuite.com
Purchasing Energy-Efficient Commercial Dishwashers - energy.gov
ENERGY STAR Commercial Food Service Newsletter - Spring 2024 - energystar.gov
2025 water Charges - Commercial - cincinnati-oh.gov - cincinnati-oh.gov
2025-2026 Water and Sewer Rate FAQ - OpenGov - stories.opengov.com
Commercial Dishwashers - Waste Reduction Partners - wastereductionpartners.org
Restaurant Maintenance Cost: How to Control Expenses & Avoid … - boh.ai
Calculating Maintenance and Reliability Initiative ROI - Cryotos CMMS - cryotos.com
How Much Does a Commercial Kitchen Fitout Cost in 2025? - canopyfitouts.com.au
Publication 946 (2024), How To Depreciate Property - IRS - irs.gov
Upcoming Changes to Depreciation in 2024 - HLB Gross Collins - hlbgrosscollins.com
Can Fire Suppression Systems Reduce Your Insurance Premiums? - radfiresprinklers.com
Cut Fire Insurance Costs by 45% with Smart Maintenance - firetestingsolutions.com
Get the week's latest industry information
-
Real-Life Professional Restaurant Case Studies
Explore Now
-
Create a unique restaurant with over 95,700+products
Explore Now
-
Protessional Free 3D Restaurant Design
Explore Now
-
Still Have Questions About Opening a Restaurant?
Explore Now

Sylvia
With 8 years in catering & hospitality industry, sales manager of Ron Group, specialise in providing one stop solutions to restaurants, hotels and weddings.
Discover Our Exclusive Products
Explore our extensive range of restaurant and hotel supplies designed to enhance your operations. Find the perfect solutions to meet your needs.
Browse Our ProductsFREE 3D DESIGN
Boost your restaurant's success with our free 3D design service. Start building the restaurant of your dreams today!
Explore 3D Design Case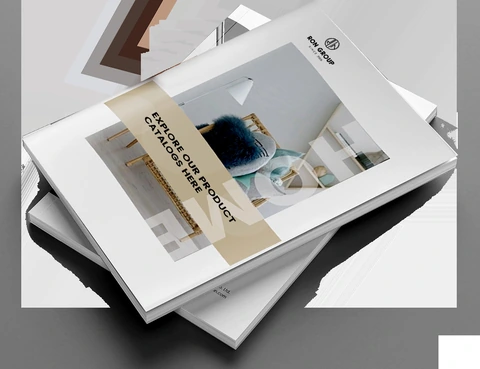
RECOMMENDED CASES
-
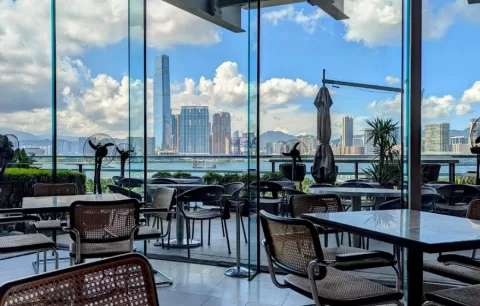
La Rambla by Catalunya: Crafting Barcelona's Soul in Hong Kong - Custom Furniture Excellence
RON Group's custom Spanish-inspired furniture elevates La Rambla with artisanal aesthetics...
Learn More -

Cardinal Point: Elevating Outdoor Seating with Tailored Cushion Upgrades
Discover how Cardinal Point transformed its outdoor dining experience with custom cushions, achievin
Learn More
RECOMMENDED BLOGS
-
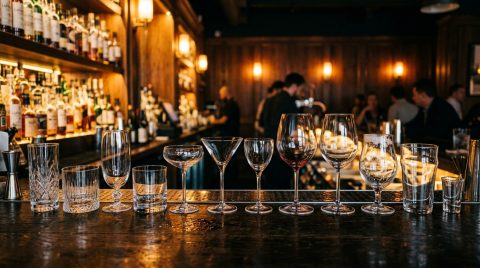
Bar Glassware 101: Types, Names, Uses, and How to Stock Your Bar
Learn the 10 core bar glassware types, names, and uses. Discover how to stock your bar with the right glasses for cocktails, beer,...
Sylvia2026-07-26 -
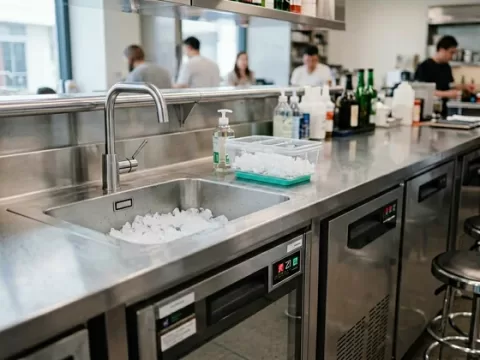
Complete Bar Equipment List for Opening a Bar
Use a complete bar equipment list with pictures, covering workstations, ice, refrigeration, glassware, utilities, sanitation and a...
Sylvia2026-06-11 -

Low-Budget Restaurant Interior Design Ideas: Spend Where Guests and Staff Notice
Explore low-budget restaurant interior design ideas, practical material choices, layout priorities and phased upgrades without...
Sylvia2026-04-04
Subscribe to RON GROUP
Stay up-to-date with the latest industry insights and expert advice. Together, we'll create your ideal restaurant.